I've carried out several projects analysing large and complex clinical datasets. Routinely those datasets are evaluated with in the first place, univariate and then multivariate logistic regression. However, I'm interested in applying the data-mining toolkit to understanding the datasets, including visualisation and applied machine learning models such as Support Vector Machines, Random Forests and Decision Trees.
Those methods often require more data, but the underlying algorithmics provides an alternative view on the dataset's inner structure, and thus alternative clinical algorithms. Such work always requires deep domain knowledge, or what follows, a tight-communication loop with the clinical collaborators.
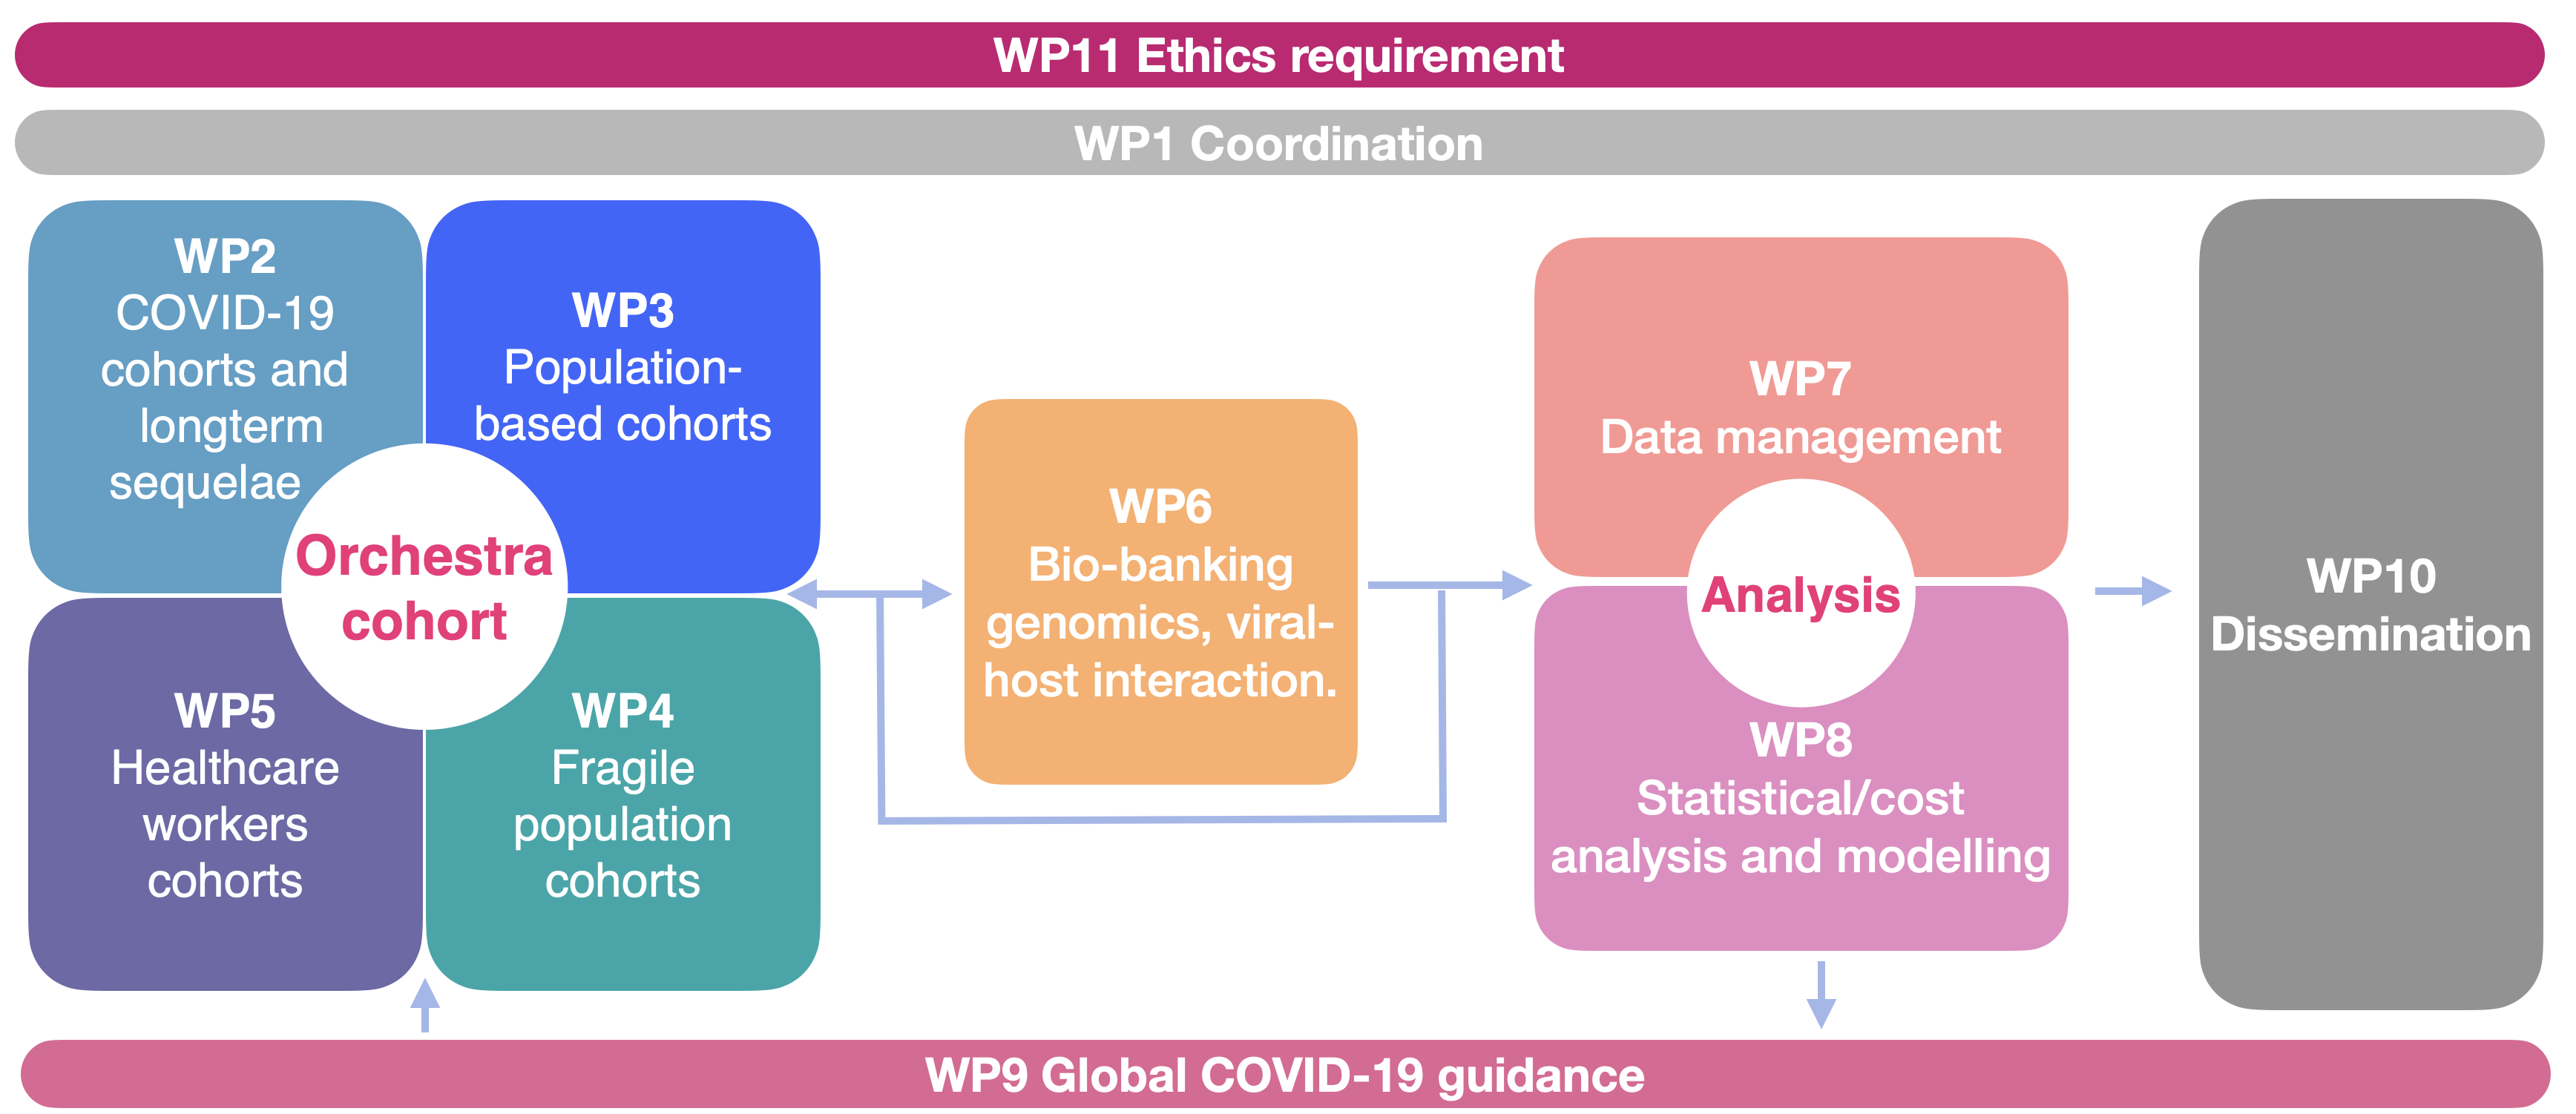
Orchestra is a large, international, interdisciplinary project funded by EU with almost 30 million euros - of which our group constitutes a coordination package. The call was opened in an emergency manner in March 2020 as a part of the EU response to the pandemic. I was engaged at the project-proposal writing stage, creating visualisations and reviewing sections related to data management.
Since the beginning of the project, October 2020, I've been devoting a considerable amount of my time to the Orchestra project. I am a representative of the WP1 to WP7 data-management package (Figure), helping with data flow and communication across the project.
For the ORCHESTRA project, I only from time to time small hands-on-data tasks. My main tasks require more project management and communication skills.
Clinical phenotypes and quality of life to define post-COVID-19 syndrome: a cluster analysis of the multinational, prospective ORCHESTRA cohort
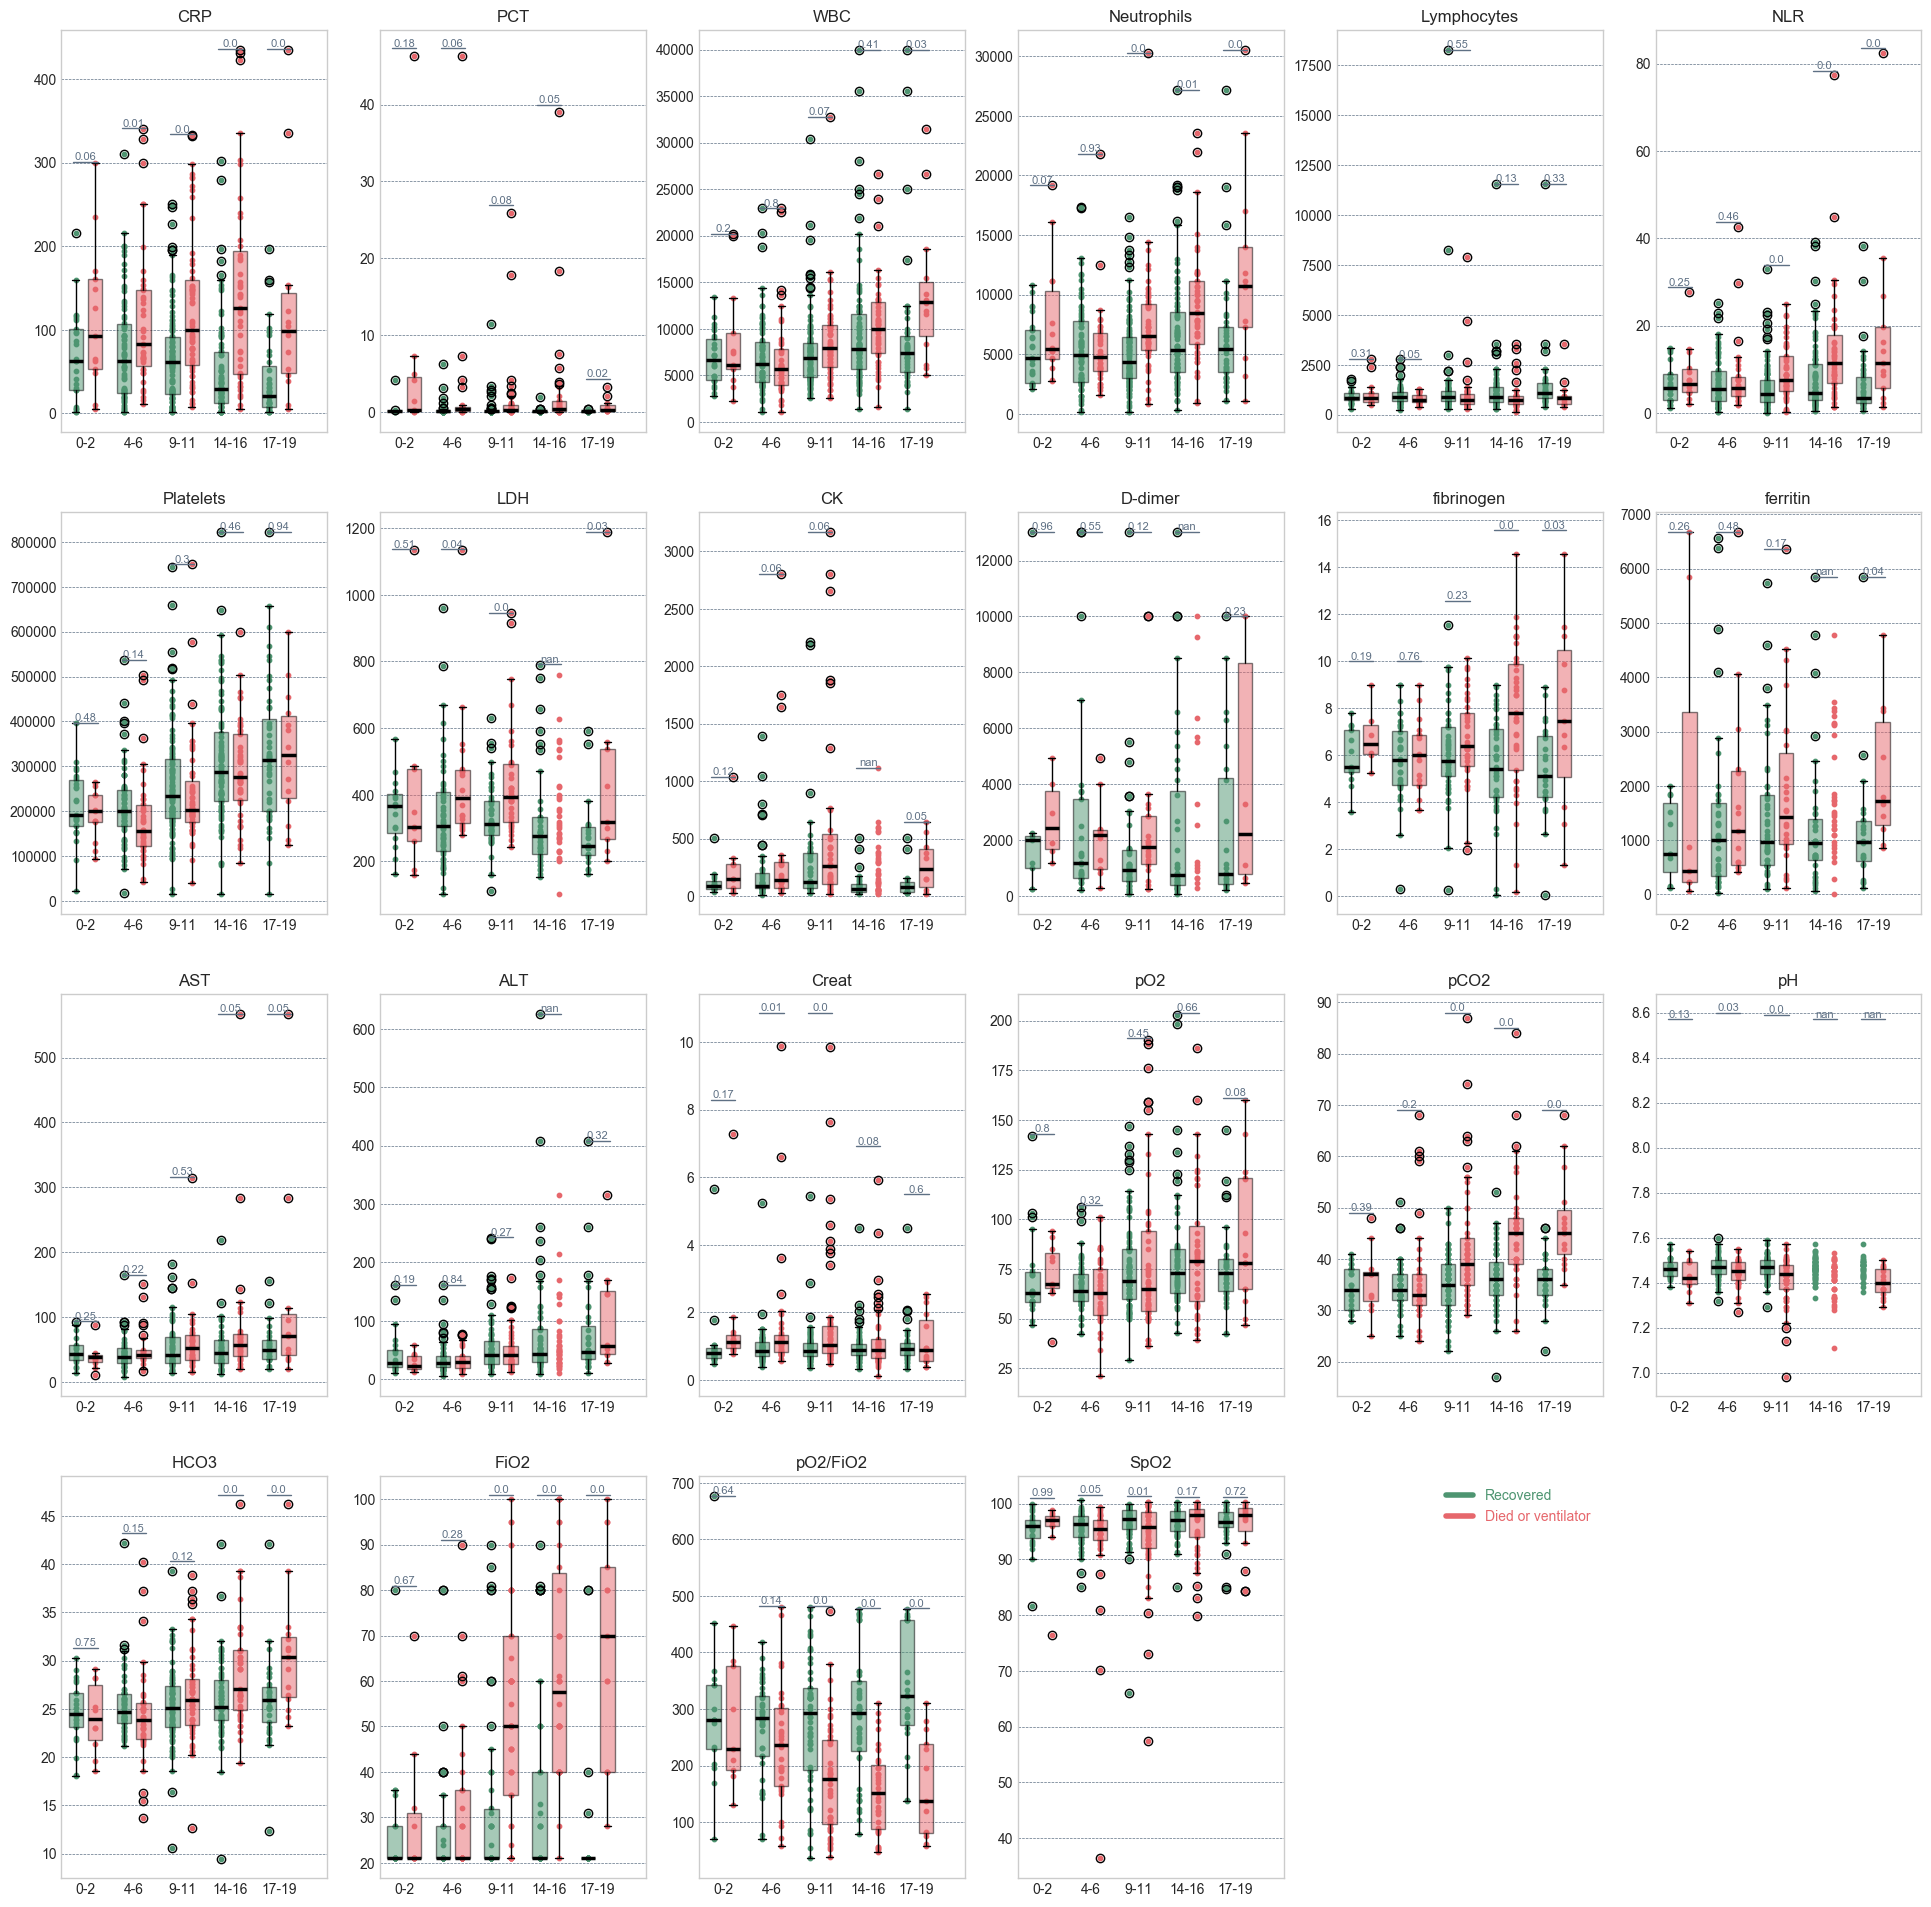
COVID19 pandemic added a lot of work to the collective plate of the Infectious Diseases department in Verona. North of Italy was one of the most affected regions in the first months of 2020. However, thanks to the experience, we quickly updated the data-collection tools to study the new virus. This dataset was too small to attempt a ML-based prediction, nevertheless we observed the development of the parameters for the positive/negative outcomes Figure.
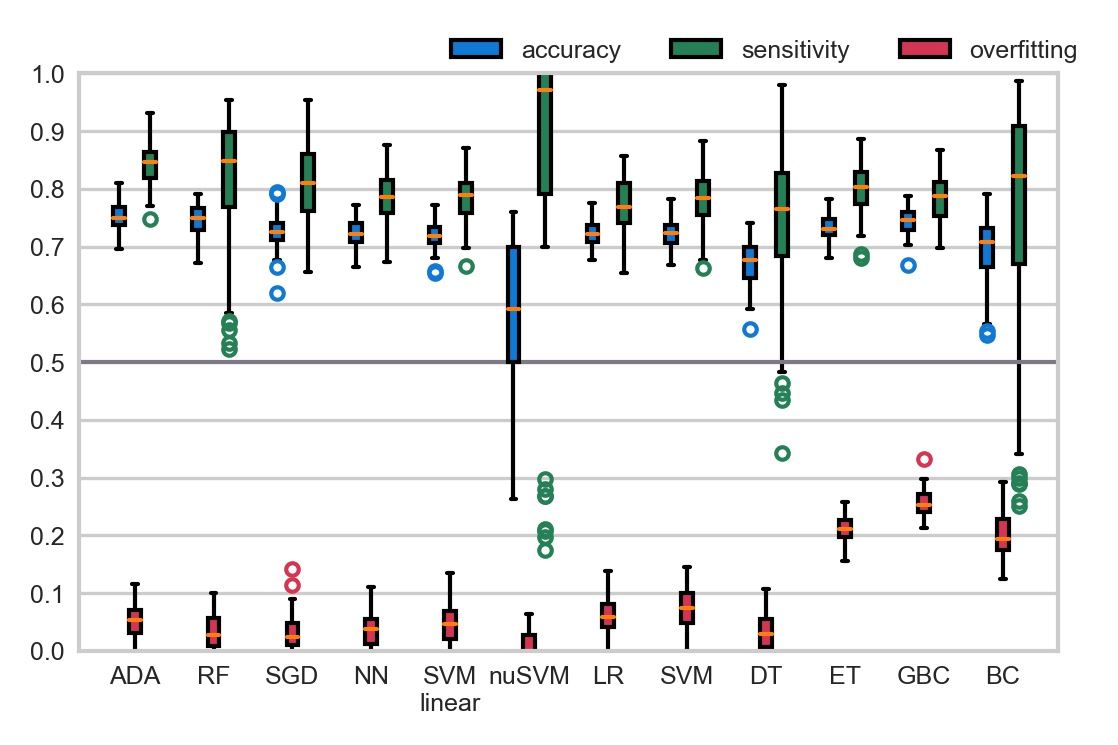
Bloomy project was a multi-centre collaboration of the German hospital-clinics aiming to develop an as early as a possible scoring system for the progression of sepsis. The dataset included ~2,500 patients with sepsis. The study followed patients longitudinally, including a post-hospitalisation follow-up, with quality of life scores. The dataset had thousands of features describing patients' demographics and comorbidities, hospital stay, treatment, antibiotics and microbiological information such as infecting bacteria. The dataset was quite complex but riddled with missing values - that needed to be inputted.
We have approached it in two ways: analysing the regression coefficients and Machine Learning methods. I build sequential models at different time points in the treatment: 3rd, 7th, end of therapy timepoints, using mainly RF, SVMs and ADABoost models (Figure). Those were subsequenlty used to select variables for the Cox proportional hazards, logistic regression, and parametric survival regression.
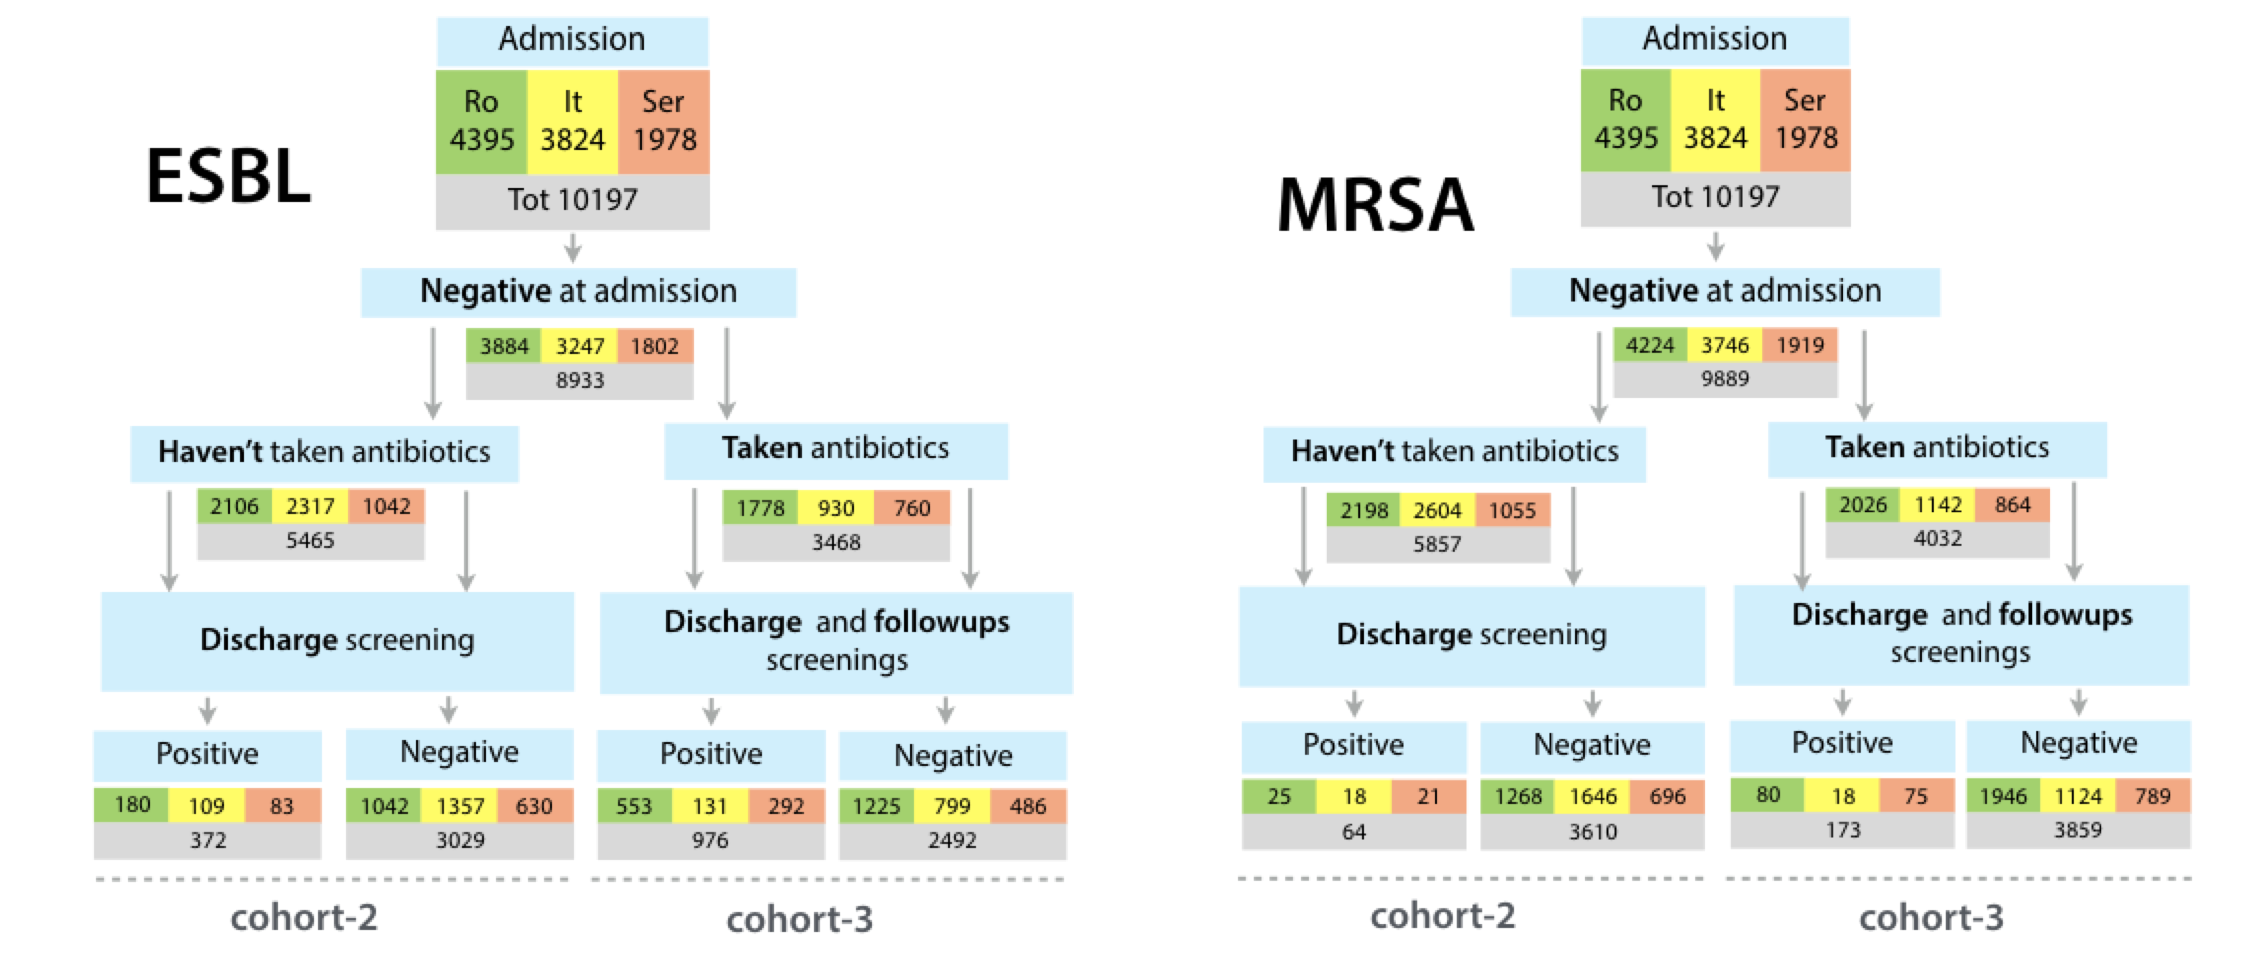
SATURN project investigated the relationship of antibiotic prescribing to the colonization with the ESBLs, and MRSA - two multi-drug resistant bacteria common in the nosocomial settings. The dataset had ~10,000 patients, whose data were collected in three countries. The participants were screened at admission to ensure their colonization happened during the study.
Figure shows basic results. As expected, many more patients got colonized with ESBLs than MRSAs. Among those patients who took antibiotics, the level of colonization with both ESBL and MRSA was ~3 times higher than in the respective group who weren't treated with antibiotics.
To analyse this dataset I've deployed a Mongodb instance to keep and quickly access the patients within the dataset. Next, I implemented a complex encoder to produce a numerical vector representing each patient, to be later fed to Random Forest, Ada Boosting, Gradient boosting and other machine learning methods. In order to encode often complex antibiotics therapy - I first included a simple length of treatment per antibiotic. For each antibiotic combination, several days, any two antibiotics were taken together. Finally, I included a binary vector that, again for each combination, encoded if one of the antibiotics was prescribed after the other. This way, a complete description of the antibiotic therapy is included in a patient vector. The 10,000 patients did not fully and equally capture the diversity of the antibiotics therapy. Nevertheless, machine learning methods were able to distinguish more and less selective antibiotic combinaitons.